[Overall Pattern of a Distribution]
수집한 통계 자료의 성격에 따라 cateogrical variable 혹은 quantitative variable 로 나눠집니다. 이렇게 분류된 자료는 categorical variable 은 bar graph (막대그래프) 나 pie chart (파이 차트) 로 quantiative variable 은 dotplot (점그래프), stemplot (줄기 그래프), historgram (히스토그램) 혹은 boxplot (박스 그래프) 를 사용해 그래프화할 수 있습니다.
그래프화된 자료는 distribution (분포도) 를 공부하는데 중요한 역할을 합니다.
Distribution (분포도) 는 variable 안에 어떤 value (값) 들이 있고 얼마나 많은 수의 데이터가 같은 value (값) 를 갖고 있는지 나타냅니다. Distribution (분포도) 을 설명할 때는 아래 네 가지 요소를 반드시 포함해야 합니다.
- Shape
- Center
- Spread
- Departure (Outlier)
(Don't forget your S(hape) O(utlier) C(enter) S(pread)!)
Shape (모양) 은 distribution (분포도) shape (모양) 의 특징을 설명하는 것으로 보통 몇 개의 peak (봉우리) 가 있는지 그리고 전체적인 모양이 어떻게 되는지를 포함합니다.
보통 distribution (분포도) 는 single-peaked (봉우리가 하나) 인 경우가 대부분입니다. 하지만 그래프화된 자료의 distribution (분포도) 에 여러 peak (봉우리) 가 있을 경우 "There are two/three/four ... peaks in the distribution." (분포도에 두 개/세 개/네 개 ... 의 봉우리가 있다.) 라고 설명할 수 있습니다.
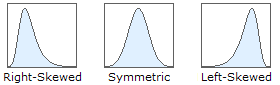
그래프가 single-peaked (봉우리가 하나) 인 경우 overall shape of a distribution (분포도의 전체적인 모양) 은 보통 아래와 같이 세 가지로 나눠집니다.
- Symmetric
- Right-skewed (Positively Skewed)
- Left-skewed (Negatively Skewed)
Symmetric
A distribution is roughly symmetric if right and left sides of the graph are approximately mirror images of each other.
만약 그래프의 오른쪽 부분과 왼쪽 부분이 mirror image (거울에 비친듯한 모습) 일 경우 distribution (분포도) 가 symmetric (대칭적) 이라고 부릅니다.
Right-skewed (Positively Skewed)
A distribuion is skewed to the right (right-skewed) if the right side of the graph (containing the half of the obserations with larger values) is much longer than the left side.
그래프의 오른쪽이 그래프의 왼쪽보다 길게 뻗어있을 경우 distribution (분포도) 가 right-skewed (오른쪽으로 꼬리가 긴) 되었다고 합니다.
* Skewed 의 원래 뜻은 치우쳤다는 의미이지만 한국어로 치우쳤다고 해석할 경우 left-skewed 그래프와 혼동할 수 있으니 주의해야 합니다.
Left-skewed (Negatively Skewed)
A disribution is skdwed to the left (left-skewed) if the left side of the graph is much longer than the right side.
그래프의 왼쪽이 그래프의 오른쪽보다 길게 뻗어있을 경우 distribution (분포도) 가 left-skewed (왼쪽으로 꼬리가 긴) 되었다고 합니다.
아주 드물게 그래프가 높낮이 없이 수직인 경우가 있습니다. 이와 같은 distribution (분포도) 를 uniform distribution 이라고 부르며 uniform distribution 은 아래와 같은 모양입니다.


No comments:
Post a Comment